
Connecting
ELK Docker 설치 방법 본문
ELK Docker 설치 방법
ELK는 Elasticsearch, Kibana, Logstash 세 가지의 오픈소스 프로젝트의 약자로, 각 제품이 연동되어 데이터 수집 및 분석도구로 많이 사용되고 있다.
필자가 다니고 있는 연구실에는 ELK를 활용하여 모든 서버의 로그기록과 서비스 메트릭 정보를 수집하여 활용하고 있다. Docker를 사용하지 않는다면 복잡한 방법으로 설치를 진행했겠지만 연구실에 Docker 서비스가 정상적으로 정착된 상황에서는 90% 이상의 서비스들이 Docker 환경에서 운영되고 있으며, 대부분의 프로젝트 역시 Docker로 빌드하여 사용하고 있다.
이번 시간에는 ELK를 Docker Compose 파일을 통해 설치하고, 운영하는 방법에 대해서 알아보도록 한다.
![]()
설치하고자 하는 서버에 다음과 같이 git clone을 진행한다.
$ git clone https://github.com/deviantony/docker-elk.git
$ cd docker-elk
deviantony/docker-elk는 기본적으로 X-Pack설정이 되어 있는데 라이센스가 존재한다면 상관이 없지만 무료로 사용해야 한다면 Elasticsearch, Kibana, Logstash 설정파일에서 X-Pack 설정을 지워준다.
config 설정 변경
-
elasticsearch config
$ vi docker-elk/elasticsearch/config/elasticsearch.yml--- ## Default Elasticsearch configuration from elasticsearch-docker. ## from https://github.com/elastic/elasticsearch-docker/blob/master/.tedi/template/elasticsearch.yml # cluster.name: "docker-cluster" network.host: 0.0.0.0 ## Use single node discovery in order to disable production mode and avoid bootstrap checks ## see https://www.elastic.co/guide/en/elasticsearch/reference/current/bootstrap-checks.html # discovery.type: single-node -
kibana config
$ vi docker-elk/kibana/config/kibana.yml--- ## Default Kibana configuration from kibana-docker. ## https://github.com/elastic/kibana-docker/blob/master/.tedi/template/kibana.yml.j2 # server.name: kibana server.host: "0" elasticsearch.hosts: [ "http://elasticsearch:9200" ] xpack.monitoring.ui.container.elasticsearch.enabled: true -
logstach config
$ vi docker-elk/logstash/config/logstash.yml--- ## Default Logstash configuration from logstash-docker. ## from https://github.com/elastic/logstash-docker/blob/master/build/logstash/config/logstash-full.yml # http.host: "0.0.0.0" xpack.monitoring.elasticsearch.hosts: [ "http://elasticsearch:9200" ]$ vi docker-elk/logstash/pipeline/logstash.confinput { tcp { port => 5000 } } ## Add your filters / logstash plugins configuration here output { elasticsearch { hosts => "elasticsearch:9200" user => "usernmaet" password => "password" } }
ELK 실행
간단하게 위의 설정파일을 진행하고 docker-elk 디렉토리로 돌아와서 다음과 같이 실행한다.
$ docker-compose build && docker-compose up -dDcoekr Swarm에서 실행하고 있다면 마스터 노드에서 다음과 같이 실행한다.
$ docker stack services elkELK 포트
기본적으로 ELK에서 사용하는 포트는 다음과 같다.
- Elasticsearch : 9200 / 9300
- Logstash : 5000/9600
- Kibana : 5601
http://$(IP-Address):5601로 접속하면 아래 사진과 같은 웹 브라우저를 볼 수 있다.
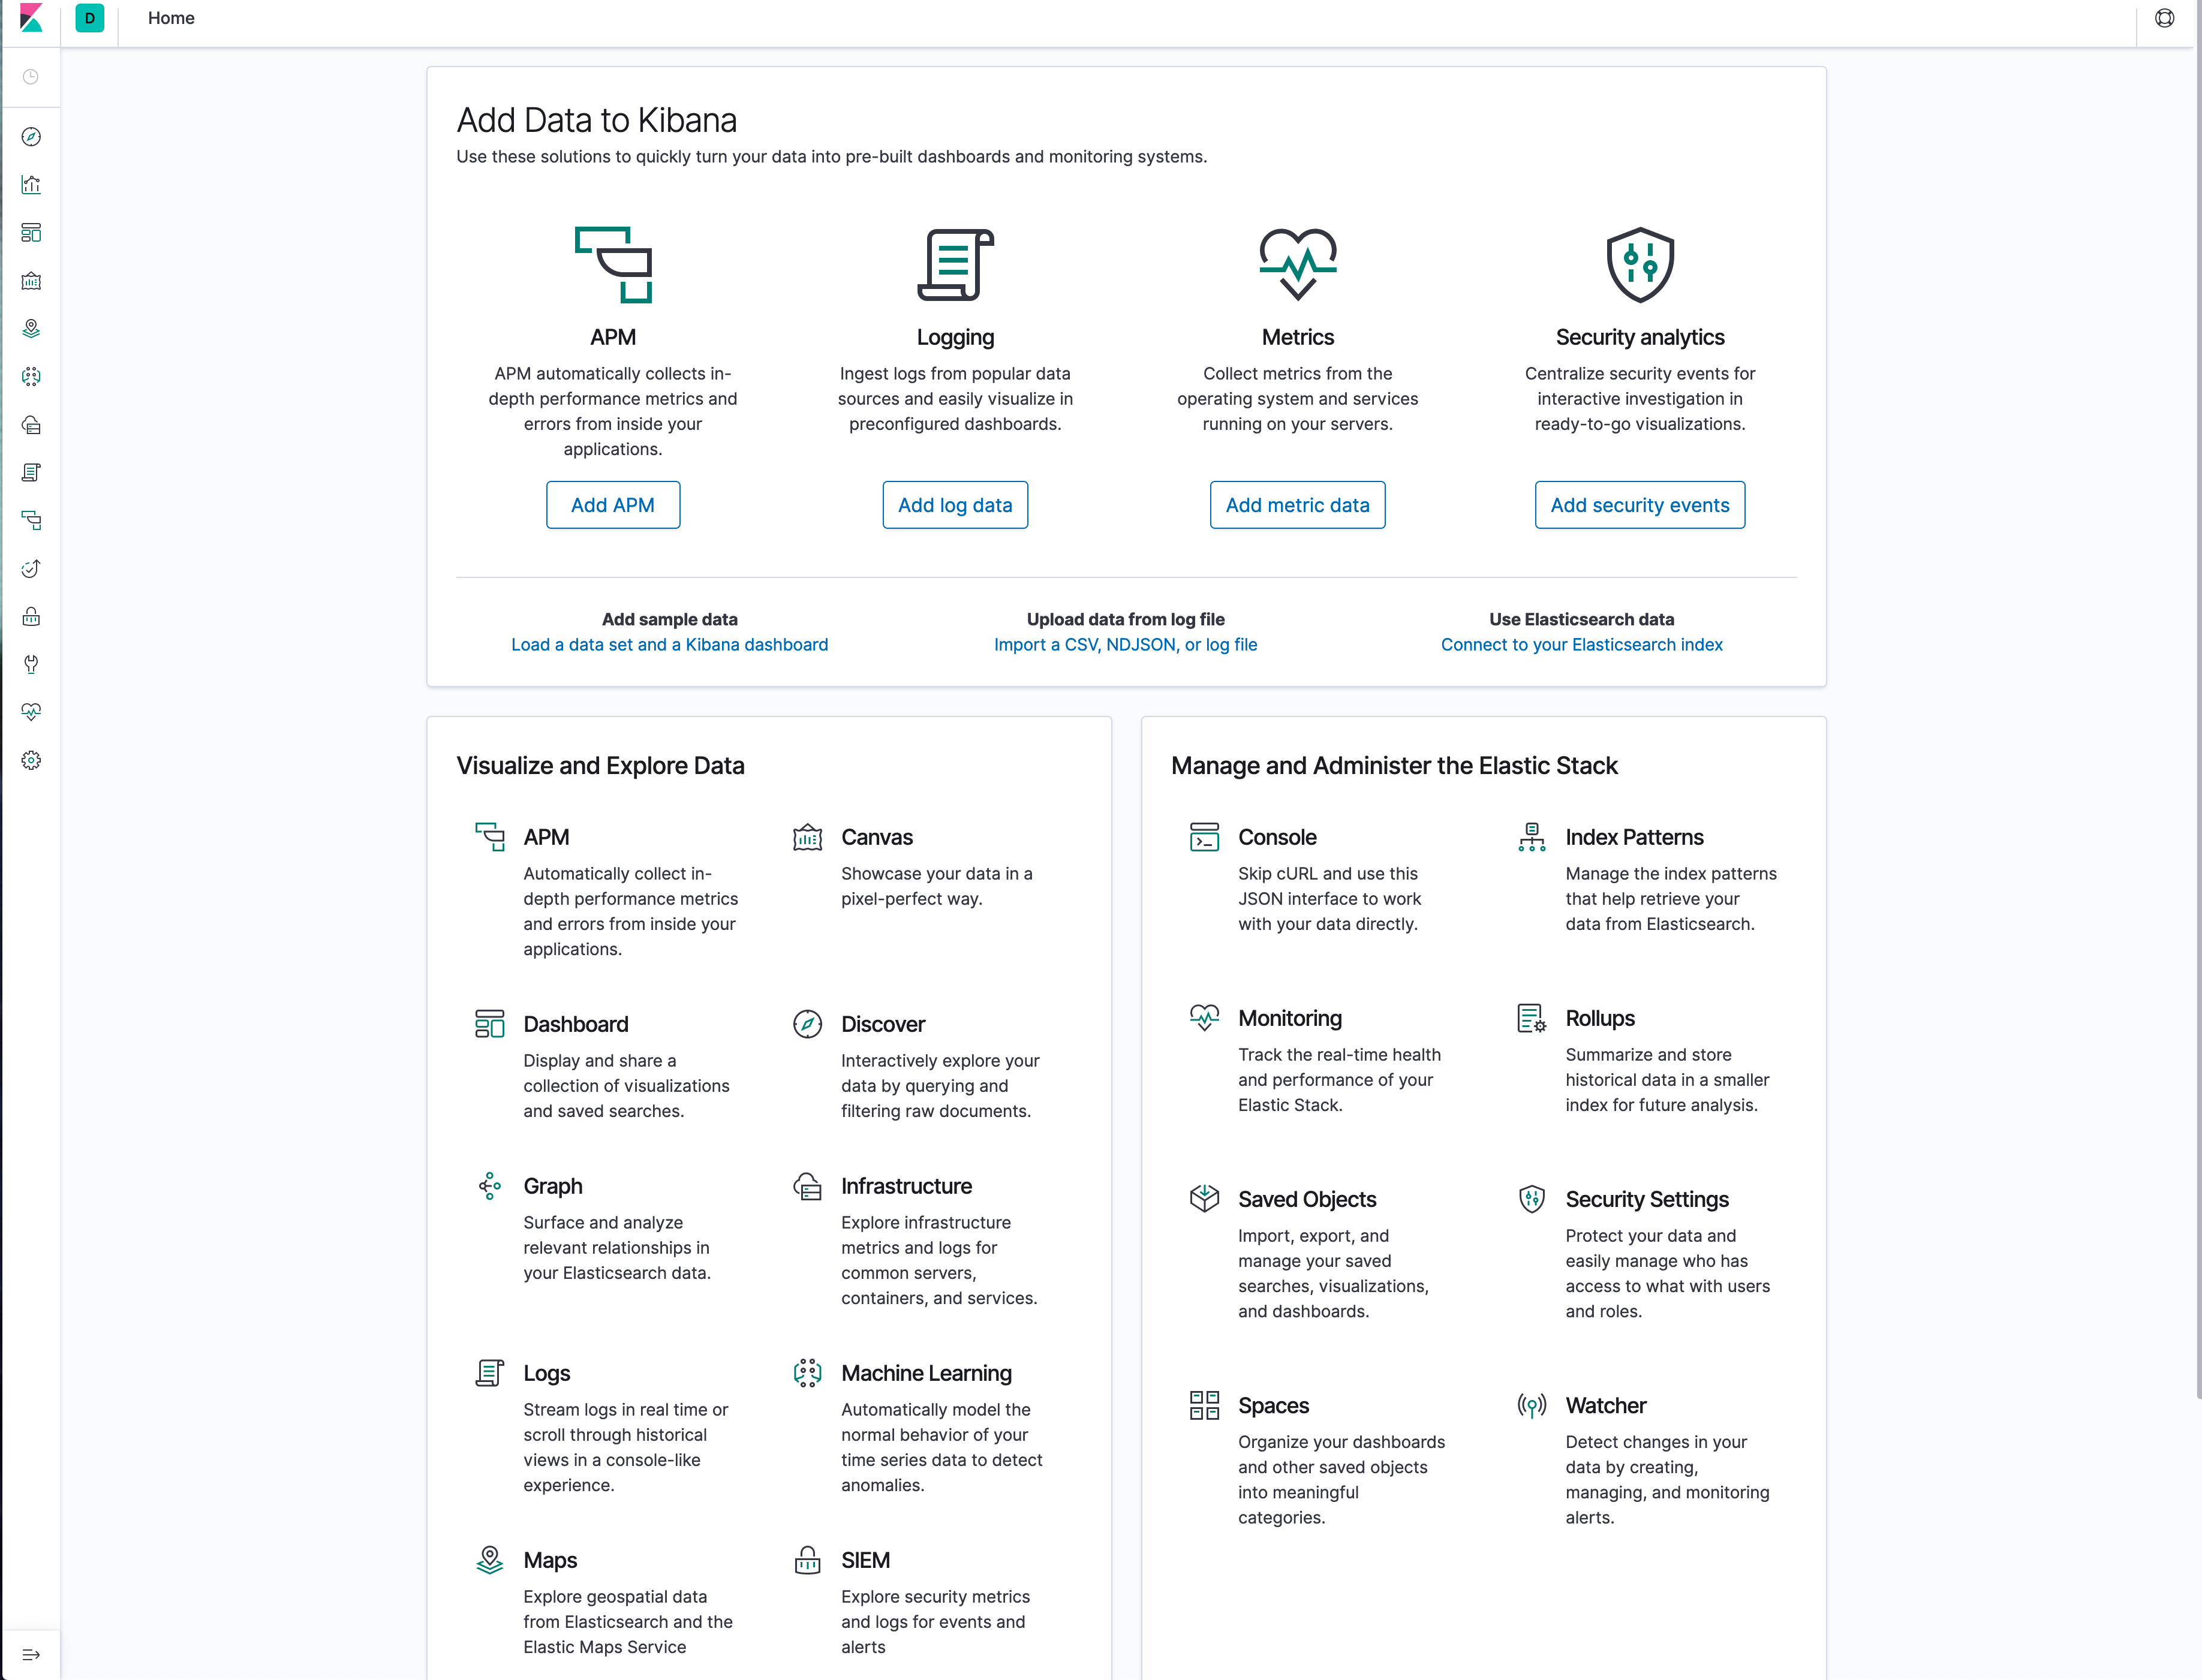
Kibana 데이터 추가
본 설정은 Ubuntu 18.04.3 LTS 기준으로 설명한다. 기본적인 System 설정 항목에서 설정방법을 살펴보며, 기타 설정파일은 추가 과정만 거치면 데이터가 수집된다.
-
Logging
$ curl -L -O https://artifacts.elastic.co/downloads/beats/filebeat/filebeat-7.2.0-amd64.deb

sudo dpkg -i filebeat-7.2.0-amd64.deb
sudo vi /etc/filebeat/filebeat.yml
#============================== Kibana ===================================== # Starting with Beats version 6.0.0, the dashboards are loaded via the Kibana API. # This requires a Kibana endpoint configuration. setup.kibana: # Kibana Host # Scheme and port can be left out and will be set to the default (http and 5601) # In case you specify and additional path, the scheme is required: http://localhost:5601/path # IPv6 addresses should always be defined as: https://[2001:db8::1]:5601 host: "<SERVER-IP>" # Kibana Space ID # ID of the Kibana Space into which the dashboards should be loaded. By default, # the Default Space will be used. #space.id:#-------------------------- Elasticsearch output ------------------------------ output.elasticsearch: # Array of hosts to connect to. hosts: ["<SERVER-IP>:9200"] # Optional protocol and basic auth credentials. #protocol: "https" username: "<USER NAME>" password: "<PASSWORD>"$ sudo filebeat modules enable system $ sudo filebeat setup $ sudo service filebeat start
-
Metrics
$ curl -L -O https://artifacts.elastic.co/downloads/beats/metricbeat/metricbeat-7.2.0-amd64.deb

$ sudo dpkg -i metricbeat-7.2.0-amd64.deb
$ sudo vi /etc/metricbeat/metricbeat.yml
#============================== Kibana ===================================== # Starting with Beats version 6.0.0, the dashboards are loaded via the Kibana API. # This requires a Kibana endpoint configuration. setup.kibana: # Kibana Host # Scheme and port can be left out and will be set to the default (http and 5601) # In case you specify and additional path, the scheme is required: http://localhost:5601/path # IPv6 addresses should always be defined as: https://[2001:db8::1]:5601 host: "<SERVER-IP>" # Kibana Space ID # ID of the Kibana Space into which the dashboards should be loaded. By default, # the Default Space will be used. #space.id:#-------------------------- Elasticsearch output ------------------------------ output.elasticsearch: # Array of hosts to connect to. hosts: ["<SERVER-IP>:9200"] # Optional protocol and basic auth credentials. #protocol: "https" username: "<USER NAME>" password: "<PASSWORD>"$ sudo metricbeat modules enable system $ sudo metricbeat setup $ sudo service metricbeat start
-
Security analytics
$ curl -L -O https://artifacts.elastic.co/downloads/beats/auditbeat/auditbeat-7.2.0-amd64.deb

$ sudo dpkg -i auditbeat-7.2.0-amd64.deb
$ sudo vi /etc/auditbeat/auditbeat.yml
#============================== Kibana ===================================== # Starting with Beats version 6.0.0, the dashboards are loaded via the Kibana API. # This requires a Kibana endpoint configuration. setup.kibana: # Kibana Host # Scheme and port can be left out and will be set to the default (http and 5601) # In case you specify and additional path, the scheme is required: http://localhost:5601/path # IPv6 addresses should always be defined as: https://[2001:db8::1]:5601 host: "<SERVER-IP>" # Kibana Space ID # ID of the Kibana Space into which the dashboards should be loaded. By default, # the Default Space will be used. #space.id:#-------------------------- Elasticsearch output ------------------------------ output.elasticsearch: # Array of hosts to connect to. hosts: ["<SERVER-IP>:9200"] # Optional protocol and basic auth credentials. #protocol: "https" username: "<USER NAME>" password: "<PASSWORD>"$ sudo auditbeat setup $ sudo service auditbeat start
설정 후 Kibana 화면에서 Dashboard에서 데이터가 수집되면 관련 정보를 시각화해서 보여지게 된다.
ELK 자동 실행
시스템을 재부팅하면 데이터가 수집되지 않는 현상이 발생할 수 있다. 이때 시스템 시작할 때 자동으로 프로그램이 실행할 수 있도록 다음과 같이 설정한다.
$ sudo systemctl enable --now auditbeat.service
$ sudo systemctl enable --now metricbeat.service
$ sudo systemctl enable --now filebeat.service'Container' 카테고리의 다른 글
| PostgreSQL, MySQL Docker 데이터베이스 초기화 하기 (0) | 2020.01.09 |
|---|---|
| Docker nGrinder (0) | 2019.08.27 |
| Mattermost 설치 및 운영하기 (9) | 2019.08.19 |
| Docker 환경과 물리머신의 성능평가 (2) | 2019.07.19 |
| Docker Swarm으로 시작하는 오케스트레이션 - 1 (0) | 2019.05.07 |


